 Ciro Santilli
This article gives an idea of how this kind of biological experiment feels like to a software engineer who has never done any biology like Ciro Santilli.
PuntSeq is a side project led by a few University of Cambridge PhDs that aims to determine which bacteria are present in the River Cam.
In July 2019, the PuntSeq team got together with the awesome Cambridge Biomakespace, an awesome biology makerspace open to all, to create a two day science outreach activity showing their procedures.
The data collected in this experiment, together with other collection sessions done by the organizers actually led to a publication on eLife: elifesciences.org/articles/61504 "Freshwater monitoring by nanopore sequencing" by Lara Urban et al. (2021), so it is awesome to see that were are actual being part of "real science".
Ciro knows nothing about biology, but since he is very curious about it, he jumped at this opportunity, and decided to document things as well as his limited knowledge would allow.
All participants chipped in some money to help cover the experiment's costs. Ciro suspects that this activity was done partially to help crowdfund the experiment, but it was a worthy investment!
The impressions you get from the experiment as a software engineer will be:
- OMG, this is so labour intensive, why haven't they automated this
- OMG, this is frightening, all the 8 hours of work I've just done are present in that tiny plastic tube
- Amazing! Look at that apparatus! And the bio people are like: I've used this a million times, it's cheap and every lab has one, just work faster and don't break you piece of junk!
For those that know biology and just want to do the thing, see: Section 9. "Protocols used".
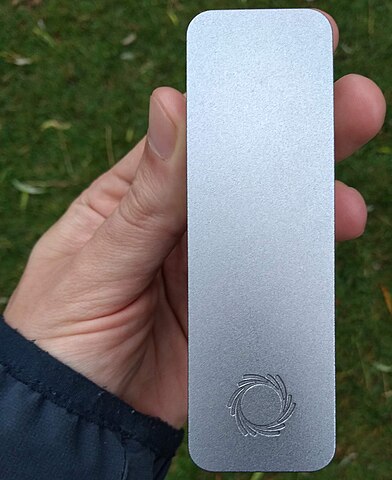
The PuntSeq team uses an Oxford Nanopore MinION DNA sequencer made by Oxford Nanopore Technologies to sequence the 16S region of bacterial DNA, which is about 1500 nucleotides long.
This kind of "decode everything from the sample to see what species are present approach" is called "metagenomics".
This is how the MinION looks like: Figure 1. "Oxford Nanopore MinION top".

The 16S region codes for one of the RNA pieces that makes the bacterial ribosome.
Before sequencing the DNA, we will do a PCR with primers that fit just before and just after the 16S DNA, in well conserved regions expected to be present in all bacteria.
The PCR replicates only the DNA region between our two selected primers a gazillion times so that only those regions will actually get picked up by the sequencing step in practice.
Eukaryotes also have an analogous ribosome part, the 18S region, but the PCR primers are selected for targets around the 16S region which are only present in prokaryotes.
This way, we amplify only the 16S region of bacteria, excluding other parts of bacterial genome, and excluding eukaryotes entirely.
Despite coding such a fundamental piece of RNA, there is still surprisingly variability in the 16S region across different bacteria, and it is those differences will allow us to identify which bacteria are present in the river.
The variability exists because certain base pairs are not fundamental for the function of the 16S region. This variability happens mostly on RNA loops as opposed to stems, i.e. parts of the RNA that don't base pair with other RNA in the RNA secondary structure as shown at: Code 1. "RNA stem-loop structure".
                A-U
               /   \
A-U-C-G-A-U-C-G     C
| | | | | | | |     |
U-A-G-C-U-A-G-C     G
               \   /
                U-A
|             ||    |
+-------------++----+
    stem        loop
Code 1.
RNA stem-loop structure
. This is how the 16S RNA secondary structure looks like in its full glory: Figure 5. "16S RNA secondary structure".

Since loops don't base pair, they are less crucial in the determination of the secondary structure of the RNA.
The variability is such that it is possible to identify individual species apart if full sequences are known with certainty.
With the experimental limitations of experiment however, we would only be able to obtain family or genus level breakdowns.
At the time of the experiment, Illumina equipment was cheaper per base pair and dominates the human genome sequencing market, but it required a much higher initial investment for the equipment (TODO how much).
The reusable Nanopore device costs just about 500 dollars, and about 500 dollars (50 unit volume) for the single usage flow cell which can decode up to 30 billion base pairs, which is about 10 human genomes 1x! Note that 1x is basically useless for one of the most important of all applications of sequencing: detection of single-nucleotide polymorphisms, since the error rate would be too high to base clinical decisions on.
Compare that to Illumina which is currently doing about an 1000 dollar human genome at 30x, and a bit less errors per base pair (TODO how much).
Other advantages of the MinION over Illumina which didn't really matter to this particular experiment are:
- portability for e.g. to do analysis on the field near infections outbreaks. Compare that to the smallest Illumina sequencer currently available in 2019, the iSeq 100: Figure 6. "Illumina iSeq 100 DNA sequencer".
- long reads which can be necessary for long repetitive regions, see also: Section "Sequence alignment"

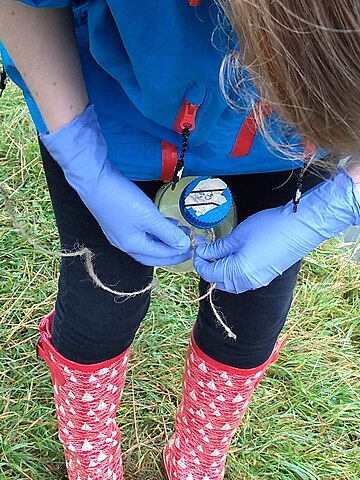
As you would expect, not much secret here, we just dumped a 1 liter glass bottle with a rope attached around the neck in a few different locations of the river, and pulled it out with the rope.
And, in the name of science, we even wore gloves to not contaminate the samples!


Measuring the river water sample temperature with a mercury thermometer
. Source. 


Noting sample collection location on the water bottle
. Source. 
The first thing we had to do with the sample was to extract the DNA present in the water in a pure form for the PCR.
We did that with a Qiagen DNeasy PowerWater Kit.
As you would expect, this consists of a purification procedure with several steps.
In each step we take a physical or chemical action on the sample, which splits it into two parts: the one with the DNA and the one without.
We then take the part with the DNA, and throw away the one without the DNA.
The first steps are coarser, and finer and finer splits are done as we move forward.
The first thing we did was to filter the water samples with a membrane filter that is so fine that not even bacteria can pass through, but water can.
Therefore, after filtration, we would have all particles such as bacteria and larger dirt pieces in the filter.
From the 1 liter in each bottle, we only used 400 ml because previous experiments showed that filtering the remaining 600 ml is very time consuming because the membrane filter gets clogged up.
Therefore, the filtration step allows us to reduce those 400 ml volumes to more manageable Eppendorf tube volumes: Figure 13. "An Eppendorf tube". Reagents are expensive, and lab bench centrifuges are small!

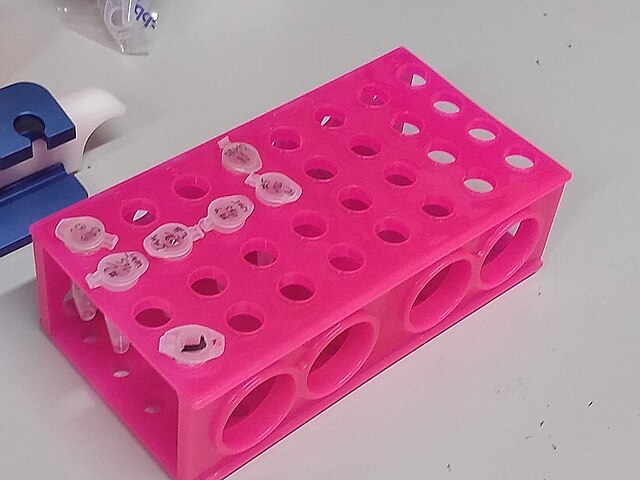
Labelled Eppendorf tubes on a rack
. Source. 
Since the filter is so fine, filtering by gravity alone would take forever, and so we used a vacuum pump to speed thing up!
For that we used:

Peeling the vacuum pump filter protection peel before usage
. Source. 

Placing the vacuum pump filter
. Source. 
After filtration, all DNA should present in the filter, so we cut the paper up with scissors and put the pieces into an Eppendorf: Video 3. "Cutting vacuum pump filter and placing it in Eppendorf".
Now that we had the DNA in Eppendorfs, we were ready to continue the purification in a simpler and more standardized lab pipeline fashion.
First we added some small specialized beads and chemicals to the water and shook them Eppendorfs hard in a Scientific Industries Inc. Vortex-Genie 2 machine to break the cell and free the DNA.
Once that was done, we added several reagents which split the solution into two phases: one containing the DNA and the other not. We would then pipette the phase with the DNA out to the next Eppendorf, and continue the process.
In one step for example, the DNA was present as a white precipitate at the bottom of the tube, and we threw away the supernatant liquid: Figure 17. "White precipitate formed with Qiagen DNeasy PowerWater Kit".

White precipitate formed with Qiagen DNeasy PowerWater Kit
. Source. 
At various stages, centrifuging was also necessary. Much like the previous vacuum pump step, this adds extra gravity to speed up the separation of phases with different molecular masses.
In our case, we used a VWR Micro Star 17 microcentrifuge for those steps:

VWR Micro Star 17 microcentrifuge.
Source. 

VWR Micro Star 17 microcentrifuge loading.
Source. 
Then, when we had finally finished all the purification steps, we measured the quantity of DNA with a Biochrom SimpliNano spectrophotometer to check that the purification went well:

Biochrom SimpliNano spectrophotometer loading sample.
Source. 

Biochrom SimpliNano spectrophotometer result readout.
Source. 
And because the readings were good, we put it in our -20 C fridge to preserve it until the second day of the workshop and called it a day:
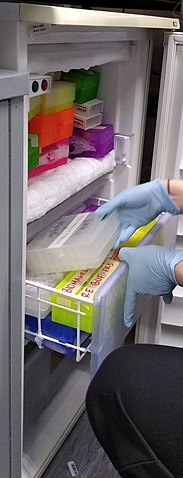
Minus 20 fridge storing samples.
Source. 
More generic PCR information at: Section "Polymerase chain reaction".
Because it is considered the less interesting step, and because it takes quite some time, this step was done by the event organizers between the two event days, so participants did not get to take many photos.
PCR protocols are very standard it seems, all that biologists need to know to reproduce is the time and temperature of each step.
We did 35 cycles of:
- 94˚C for 30 seconds
- 60˚C for 30 seconds
- 72˚C for 45 seconds
This process used a Marshal Scientific MJ Research PTC-200 Thermal Cycler:

Marshal Scientific MJ Research PTC-200 Thermal Cycler.
Source. 
We added PCR primers for regions that surround the 16S DNA. The primers are just bought from a vendor, and we used well known regions are called 27F and 1492R. Here is a paper that analyzes other choices: academic.oup.com/femsle/article/221/2/299/630719 (archive) "Evaluation of primers and PCR conditions for the analysis of 16S rRNA genes from a natural environment" by Yuichi Hongoh, Hiroe Yuzawa, Moriya Ohkuma, Toshiaki Kudo (2003)
One cool thing about the PCR is that we can also add a known barcode at the end of each primer as shown at Code 2. "PCR diagram".
This means that we bought a few different versions of our 27F/1492R primers, each with a different small DNA tag attached directly to them in addition to the matching sequence.
This way, we were able to:
- use a different barcode for samples collected from different locations. This means we
- did PCR separately for each one of them
- for each PCR run, used a different set of primers, each with a different tag
- the primer is still able to attach, and then the tag just gets amplified with the rest of everything!
- sequence them all in one go
- then just from the sequencing output the barcode to determine where each sequence came from!
Input: Bacterial DNA (a little bit)
... --- 27S --- 16S --- 1492R --- ...

|||
|||
vvv

Output: PCR output (a lot of)
Barcode --- 27S --- 16S --- 1492R
Code 2.
PCR diagram
. Finally, after purification, we used the Qiagen QIAquick PCR Purification Kit protocol to purify the generated from unwanted PCR byproducts.
Biology experiments are hard, and so they go wrong, a lot.
For this reason, it is wise to verify that certain steps are correct whenever possible.
And so this is the first thing we did on the second day!
Gel electrophoresis separates molecules by their charge-to-mass ratio. It is one of those ultra common lab procedures!
This allows us to determine how long are the DNA fragments present in our solution.
Since we know that we amplified the 16S regions which we know the rough size of (there might be a bit of variability across species, but not that much), we were expecting to see a big band at that size.
And that is exactly what we saw!
First we had to prepare the gel, put the gel comb, and pipette the samples into wells present in the gel:

Gel electrophoresis insert comb.
Source. 

Gel electrophoresis top view with wells visible.
Source. 

Gel electrophoresis pipette sample into wells.
Source. 
To see the DNA, we added ethidium bromide to the samples, which is a substance that that both binds to DNA and is fluorescent.
Because it interacts heavily with DNA, ethidium bromide is a mutagen, and the biology people sure did treat the dedicated electrophoresis bench area with respect! Figure 27. "Gel electrophoresis dedicated bench area to prevent ethidium bromide contamination.".

Gel electrophoresis dedicated bench area to prevent ethidium bromide contamination.
Source. 

Gel electrophoresis dedicated waste bin for centrifuge tubes and pipette tips contaminated with ethidium bromide.
Source. 
The UV transilluminator we used to shoot UV light into the gel was the Fisher Scientific UVP LM-26E Benchtop 2UV Transilluminator. The fluorescent substance then emitted a light we can see.
As barely seen at Figure 31. "Fischer Scientific UVP LM-26E Benchtop 2UV Transilluminator illuminated gel." due to bad photo quality due to lack of light, there is one strong green line, which compared to the ladder matches our expected 16S length. What we saw it with the naked eyes was very clear however.
Fischer Scientific UVP LM-26E Benchtop 2UV Transilluminator
. Source. 
Fischer Scientific UVP LM-26E Benchtop 2UV Transilluminator loading gel.
Source. 
Fischer Scientific UVP LM-26E Benchtop 2UV Transilluminator illuminated gel.
Source. 
Once we had the amplified 16S DNA, we were almost ready to start sequencing!
One cool thing we did in this procedure was to use magnetic separation with magnetic beads to further concentrate the DNA: Figure 32. "GE MagRack 6 pipetting.".
The beads are coated to stick to the DNA, which allows us to easily extract the DNA from the rest of the solution. This is cool, but bio people are borderline obsessed by those beads! Go figure!

GE MagRack 6 pipetting.
Source. 

GE MagRack 6 eppendorf with magnetic beads mounted.
Source. 
Then we prepared the DNA for sequencing with the Oxford Nanopore specific part: Oxford Nanopore SQK-LSK109 Ligation Sequencing Kit.
Here some of the steps required a bit more of vortexing for mixing the reagents, and for this we used the VELP Scientifica WIZARD IR Infrared Vortex Mixer which appears to be quicker to use and not as strong as the Vortex Genie 2 previously used to break up the cells:

VELP Scientifica WIZARD IR Infrared Vortex Mixer running.
Source. 
After all that was done, the DNA of the several 400 ml water bottles and hours of hard purification labour were contained in one single Eppendorf!
With all this ready, we opened the Nanopore flow cell, which is the 500 dollar consumable piece that goes in the sequencer.
We then had to pipette the final golden Eppendorf into the flow cell. My anxiety levels were going through the roof: Figure 38. "Oxford nanopore MinION flow cell pipette loading.".

Oxford nanopore MinION flow cell package.
Source. 
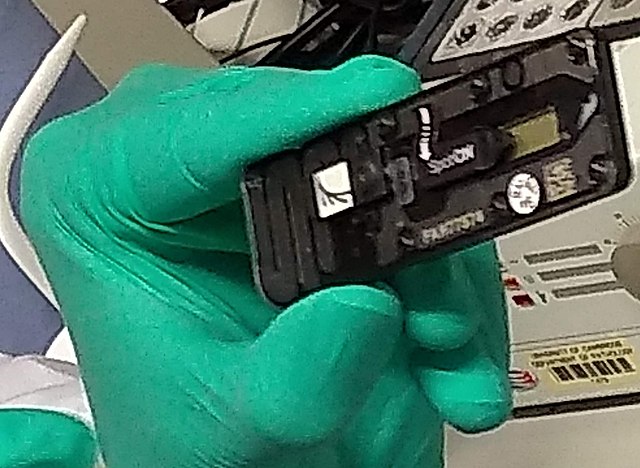
Oxford nanopore MinION flow cell front.
Source. 
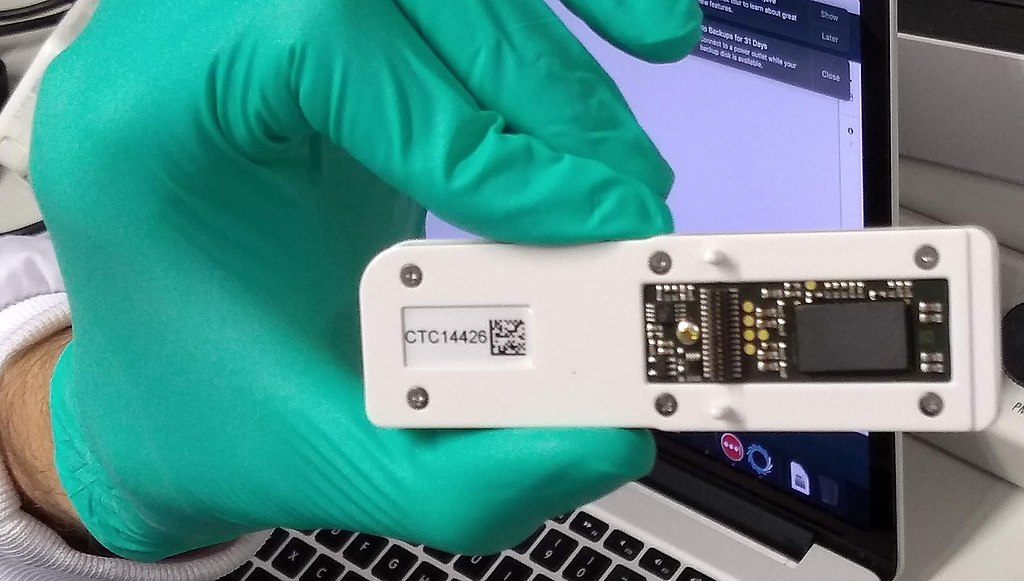
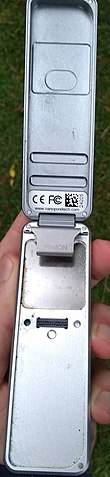
Oxford nanopore MinION flow cell back.
Source. 

Oxford nanopore MinION flow cell pipette loading.
Source. 
At this point bio people start telling lab horror stories of expensive solutions being spilled and people having to recover them from fridge walls, or of how people threw away golden Eppendorfs and had to pick them out of trash bins with hundreds of others looking exactly the same etc. (but also how some discoveries were made like this). This reminded Ciro of: youtu.be/89UNPdNtOoE?t=919 Alfred Maddock's plutonium spill horror story.
Luckily this time, it worked out!
We then just had to connect the MinION to the computer, and wait for 2 days.
During this time, the DNA would be sucked through the pores.
As can be seen from Video 6. "Oxford Nanopore MinION software channels pannel on Mac." the software tells us which pores are still working.
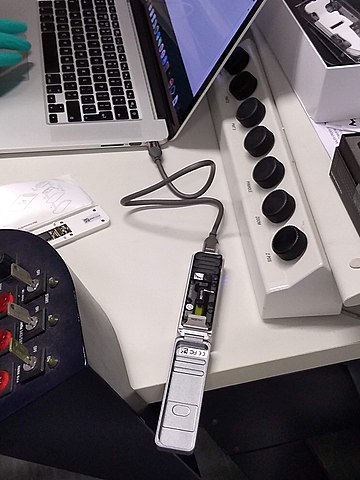
Oxford Nanopore MinION connected to a Mac via USB.
Source. 
Pores go bad sooner or later randomly, until there are none left, at which point we can stop the process and throw the flow cell away.
48 hours was expected to be a reasonable time until all pores went bad, and so we called it a day, and waited for an email from the PuntSeq team telling us how things went.
We reached a yield of 16 billion base pairs out of the 30Gbp nominal maximum, which the bio people said was not bad.
Because Ciro's a software engineer, and he's done enough staring in computers for a lifetime already, and he believes in the power of Git, he didn't pay much attention to this part ;-)
According to the eLife paper, the code appears to have been uploaded to: github.com/d-j-k/puntseq. TODO at least mention the key algorithms used more precisely.
Ciro can however see that it does present interesting problems!
Because it was necessary to wait for 2 days to get our data, the workshop first reused sample data from previous collections done earlier in the year to illustrate the software.
First there is some signal processing/machine learning required to do the base calling, which is not trivial in the Oxford Nanopore, since neighbouring bases can affect the signal of each other. This is mostly handled by Oxford Nanopore itself, or by hardcore programmers in the field however.
After the base calling was done, the data was analyzed using computer programs that match the sequenced 16S sequences to a database of known sequenced species.
This is of course not just a simple direct string matching problem, since like any in experiment, the DNA reads have some errors, so the program has to find the best match even though it is not exact.
The PuntSeq team would later upload the data to well known open databases so that it will be preserved forever! When ready, a link to the data would be uploaded to: www.puntseq.co.uk/data
- against all odds, the experiment worked and we got DNA out of the water, despite a bunch of non-bio newbs actively messing with random parts of the experiment
- PuntSeq and Biomakespace people, and all those tho do scientific outreach, are awesome!
- biology is hard
- creating insanely media rich articles like this is also hard, but the following helped enormously:
- Wikimedia Commons to store large media files out of Git
- Asciidoctor extensions to easily include those media files. The lessons learnt in this article were then an important motivation for Ciro's OurBigBook Markup, to which this article was later migrated.
- Nomacs to give Google Photos photos meaningful names and to edit people's faces out of pictures ;-)
- some scientific Wikipedia pages may or may not have been edited with better pictures during the course of writing this article
Protocols are the biologist term for "recipe".
I found that a lot of biology comes down to this: get the right recipe, follow it well even though you don't understand all the proprietary details, and pray.
www.qiagen.com/gb/products/discovery-and-translational-research/dna-rna-purification/dna-purification/microbial-dna/dneasy-powerwater-kit (archive) Here is its documentation: www.qiagen.com/gb/resources/download.aspx?id=bb731482-874b-4241-8cf4-c15054e3a4bf&lang=en (archive).
Manual archive: web.archive.org/web/20190911111136/https://www.qiagen.com/gb/resources/download.aspx?id=bb731482-874b-4241-8cf4-c15054e3a4bf&lang=en
Kit to extract clean DNA from water.

Qiagen DNeasy PowerWater Kit open box.
Source. 
www.qiagen.com/us/products/discovery-translational-research/dna-rn-a-purification/dna-purification/dna-clean-up/qiaquick-pcr-purification-kit/#orderinginformation (archive)
Manual archive: web.archive.org/web/20190911100243/https://www.qiagen.com/us/resources/download.aspx?id=e0fab087-ea52-4c16-b79f-c224bf760c39&lang=en
Removes PCR byproducts from purified DNA.
Repairs the ends of DNA, and also attaches an adapter protein to the DNA that makes them go through the pores of e.g. an Oxford Nanopore MinION.
www.fishersci.no/shop/products/nalgene-polysulfone-reusable-bottle%20-top-filters/10465781 (archive)
This is where we poured the water. It was not large enough for the entire 1L sample, so we had to do it a few times.
uk.vwr.com/store/product/8306728/microcentrifuges-ventilated-refrigerated-micro-star-17-17r (archive).
www.velp.com/en/products/lines/3/family/44/vortex_mixers/65/wizard_ir_infrared_vortex_mixer (archive).
www.gelifesciences.com/en/us/shop/protein-analysis/protein-sample-preparation/protein-enrichment/magrack-6-p-05761 (archive).
www.bidspotter.com/en-us/auction-catalogues/bscsur/catalogue-id-bscsur10011/lot-c6605b41-1a14-40e5-a255-a5c5000866e0 (archive) Cannot exact same product on official website, but here is a similar one: www.fishersci.co.uk/shop/products/lm-26-2uv-transilluminator/12382038 (archive).
Manual: biochromspectros.com/media/wysiwyg/support_page/support-simplinano/Simplinano-UM.pdf (archive)
- 2021-03-25: Oxford Nanopore Technologies retweeted this article, that's awesome!
- 2021: hackaday.com/author/wd5gnr1/ "SEQUENCING DNA FOR METAGENOMICS" by Al Williams (2021). This came after Ciro Santilli self promoted at: stackoverflow.blog/2021/02/03/sequencing-your-dna-with-a-usb-dongle-and-open-source-code/#comment-1411921